Hi everyone,
Alan here. I recently published a post introducing the concept of Big Data and how we can leverage the extensive dataset available in Hedger Pro.
The feedback was encouraging, so I’m building on that theory to demonstrate how to develop a system using minimal filters.
The goal is to create a system with historically greater than 10,000 bets that shows consistent Strike Rate and Yield over Hedger Pro’s nearly five years of data.
👉 Click here to learn more about the Hedger Pro platform and join our community!
Defining Big Data and Our Hedger Pro Challenge
Let’s start with a formal definition of Big Data:
Big Data is defined as extremely large data sets that may be analysed computationally to reveal patterns, trends, and associations, especially relating to human behaviour and interactions.
What exactly are we working with in Hedger Pro? As of today, the available data includes:
61,862 races
580,428 runners
This data covers a plethora of races across the UK and Ireland, including different race types, classifications, and field sizes.
The challenge for the user is analysing this data to find the “Goldilocks formula”—a system with not too many filters (which makes it too niche and likely over-backfitted) and not too few filters (which creates a system with an unworkable drawdown).
Avoiding Over-Backfitting
Over-backfitting is probably the most common issue for all users. I think I’ve been way too guilty of looking for the drawdown “Holy Grail” and have probably ruined reasonable systems that would have been profitable over time.
For the last two months, I’ve changed my approach and focused on:
Minimal filters
Big sample sizes
Worrying less about drawdown
As I show in the video, I now look at the consistency of Strike Rate and Yield over multiple different anti-backfit periods to give me increased confidence in the system.
The sample system I detail below has the lowest number of filters and the highest number of historical bets I have managed to achieve so far.
Sample System Performance
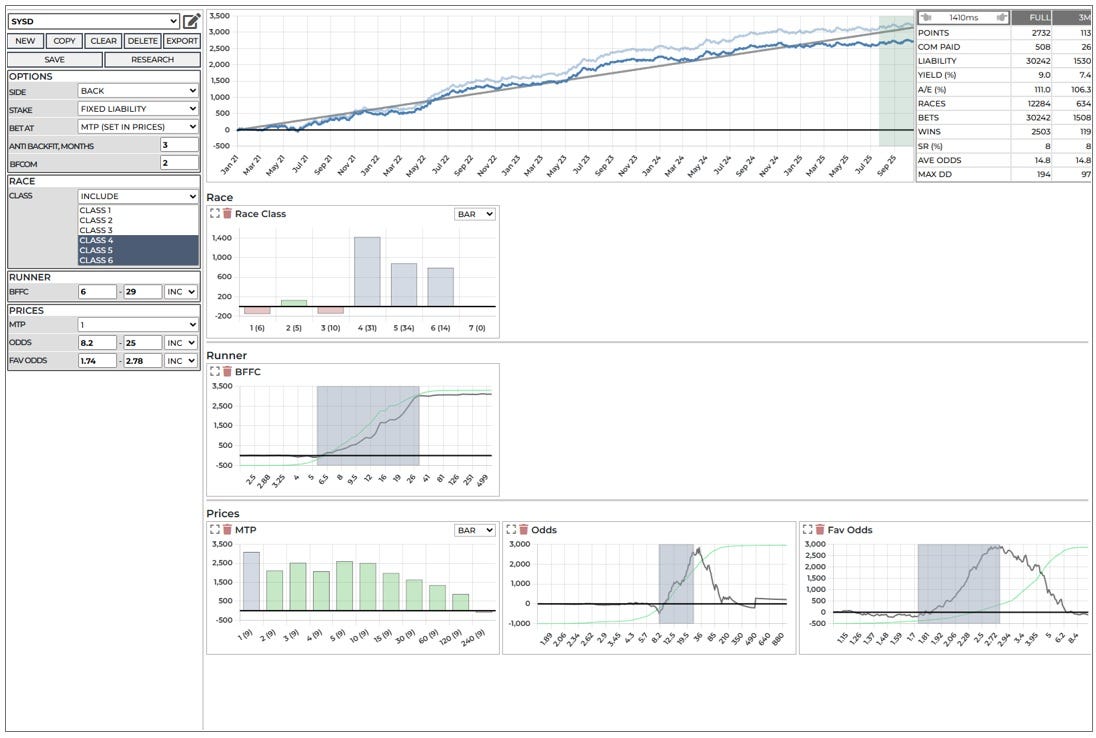
I used a total of five filters for this system, applied in this order: MTP, ODDS, Favourite Odds, BFFC, and Race Class.
Here is the system’s historical performance:
Total Bets: 30,242
Winners: 2,503
Total Points: 2,732
Maximum Drawdown (Max DD): 194
Strike Rate: 8%
Yield: 9%
I’m going to run this system as is—using small stakes to see how it performs in real-time. Could this be optimized? Undoubtedly—but I’ll leave that to you.
Summary
Look at less filters, not more. Focus on big historic bet pools that give you confidence in your system’s long-term viability.
Thank you for your attention, I hope you found this post useful.
Alan
Call to Action: Take the 7 day Hedger Pro free trial and test the power of the race data research, and then apply this to your own Automated Betting Systems all within one platform: https://www.hedgerpro.co.uk/


